- Accessibility Options:
- Skip to Content
- Skip to Search
- Skip to footer
- Office of Disability Services
- Request Assistance
- 305-284-2374
- Display:
- Default
- High Contrast
- Apply
- About UM
- Give to UM
-
Schools
- School of Architecture
- College of Arts and Sciences
- Miami Herbert Business School
- School of Communication
- School of Education and Human Development
- College of Engineering
- School of Law
- Rosenstiel School of Marine, Atmospheric, and Earth Science
- Miller School of Medicine
- Frost School of Music
- School of Nursing and Health Studies
- The Graduate School
- Division of Continuing and International Education
- Alumni


- Surface circulation
- Circulation at 1000m
- Particle trajectories: scenarios of alternative spill sites
- Particle trajectories: daily launches near the Deepwater Horizon location
- Particle trajectories at 400m depth - launched at the Deepwater Horizon location
- Particle trajectories below the mixed layer - launched at the Deepwater Horizon location
- Particle trajectories: launches in the Loop Current - Scenario 1
- Particle trajectories: launches in the Loop Current - Scenario 2
- Particle trajectories: launches in the Loop Current - Scenario 3
- Particle trajectories: launches in the Loop Current - Scenario 4
- Particle trajectories: hourly input at the Deepwater Horizon location
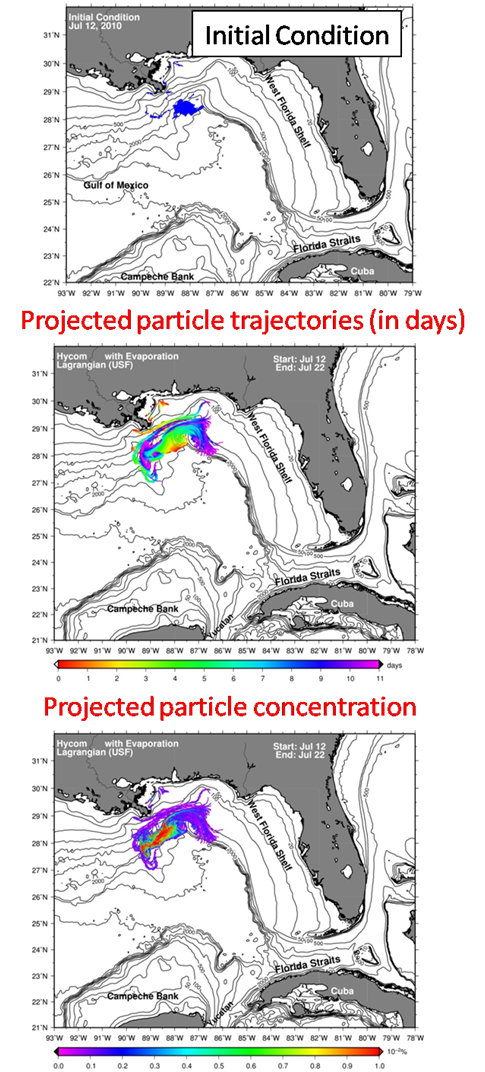
- Particle trajectories prediction (surface): Initial locations inferred from oil patch images (July 12 to Jul 22)
- CONE - Connectivity controlled by Eddies: Gulf of Mexico offshore and coastal links of hydrocarbons
- Media Coverage
- Surface circulation
- Circulation at 1000m
- Particle trajectories: scenarios of alternative spill sites
- Particle trajectories: daily launches near the Deepwater Horizon location
- Particle trajectories at 400m depth - launched at the Deepwater Horizon location
- Particle trajectories below the mixed layer - launched at the Deepwater Horizon location
- Particle trajectories: launches in the Loop Current - Scenario 1
- Particle trajectories: launches in the Loop Current - Scenario 2
- Particle trajectories: launches in the Loop Current - Scenario 3
- Particle trajectories: launches in the Loop Current - Scenario 4
- Particle trajectories: hourly input at the Deepwater Horizon location
- Particle trajectories prediction (surface): Initial locations inferred from oil patch images (July 12 to Jul 22)
- CONE - Connectivity controlled by Eddies: Gulf of Mexico offshore and coastal links of hydrocarbons
- Media Coverage