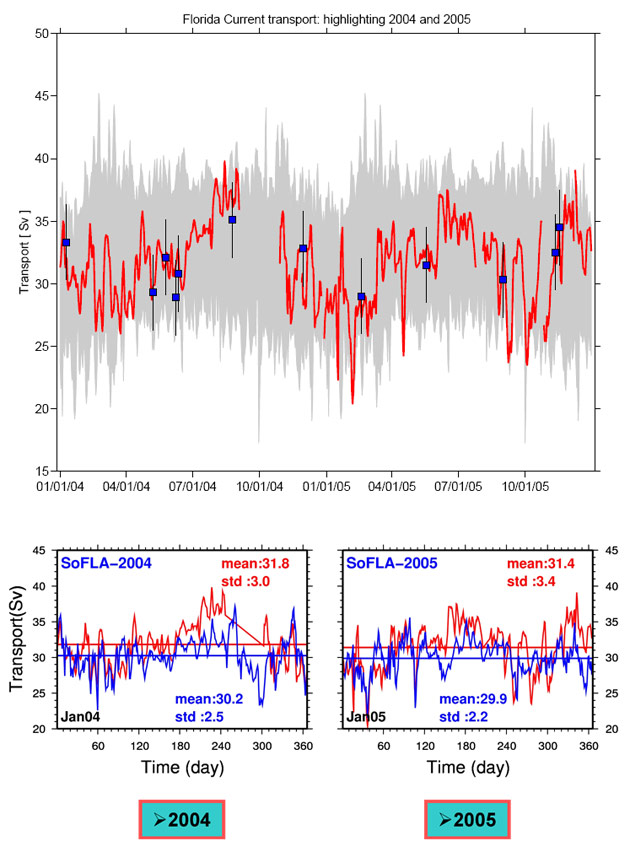
Daily transports of the Florida Current have been inferred nearly continuously since 1982 by the NOAA cable data near 27°N by taking advantage of the simple electromagnetic principle that a charged particle moving through a magnetic field induces an electric field perpendicular to the direction of motion. In this application, the charged particles (salt ions) in seawater carried by the Florida Current produce an electric field across the Straits of Florida, as they move through the magnetic field of the Earth. By measuring the voltage induced on a submarine telephone cable across the Straits, an estimate of the Florida Current transport can be obtained. This unique data set represents the only long time series of ocean current transport available, and it is particularly valuable given the important role that the Florida Current plays as both the western boundary current of the subtropical Atlantic gyre and the warm water route for the Meridional Overturning Circulation.


